Keepers of the Trees
At the Florida Interactive Entertainment Academy I had the honor of working with 20 other talented individuals on our 7 month capstone project. This was a multidisciplinary team of 4 3D artists, 1 animator, 3 tech artists, 2 project managers, 5 level designers, 3 tech designers, and 3 programmers, including myself.
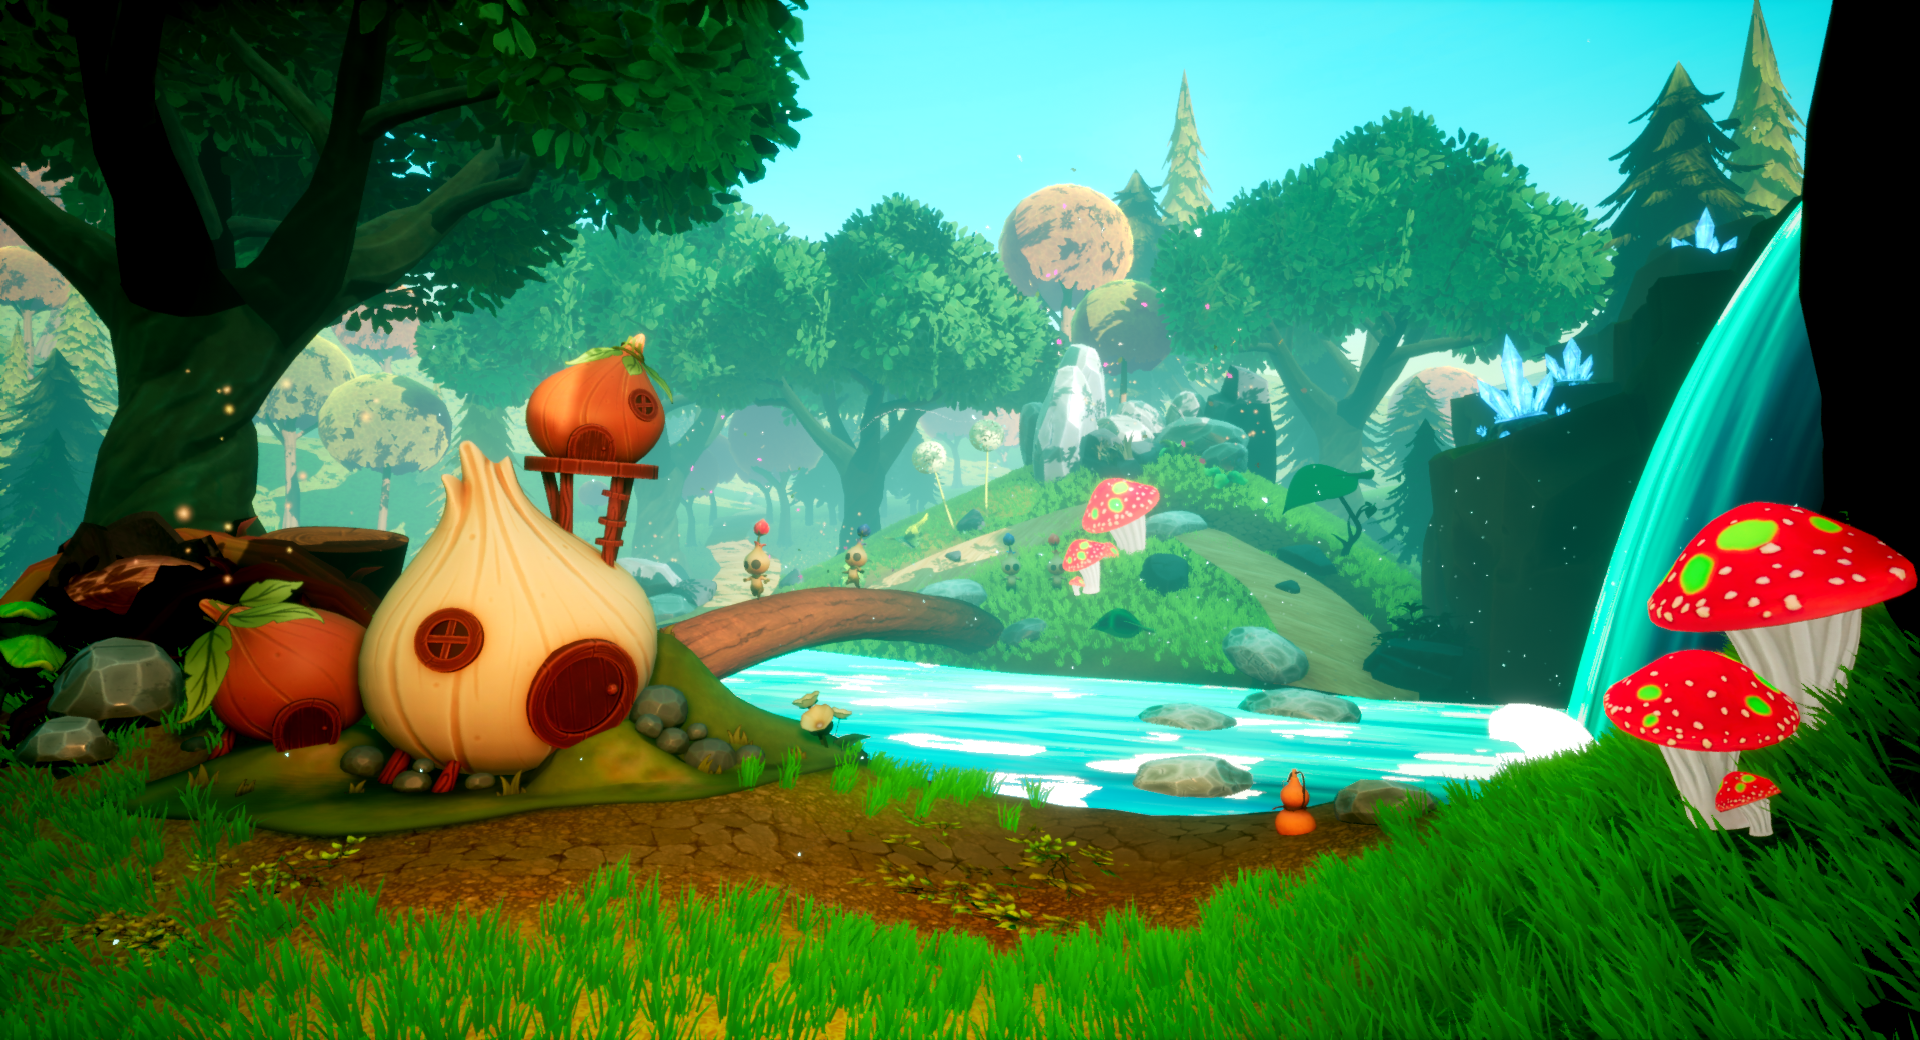
Our project was Keepers of the Trees. A 2-player couch co-op puzzle game with a joyful plant-i-ful aesthetic. In the game, you play as a Keeper: a tiny little magical creature who use powers to keep the forest alive. The chief mechanic of the game is to pick up seeds and plant them, growing them into various different plants to help you on your journey.
On this project, I was our tools programmer. I designed and implemented various methods of recording and analyzing analytics to be used with playtesting our game. I created these in a generic fashion as Unreal plugins so that they can be re-purposed for any project and indeed they saw use with the other capstone teams of our cohort.
I did also implement some gameplay features of our project, mainly the plant which the team and faculty agree is the most interesting of them all: The beanstalk.
Beanstalk
The beanstalk in our game serves the same purpose as ladders and ziplines in most games: it’s a more interesting way of getting around than just walking. The way it works is the player picks up a beanstalk seed. They then plant it somewhere and it grows towards the nearest light source. Through the Keeper’s magical abilities, the player can grow and degrow the beanstalk at will.
When originally tasked with creating the beanstalk, I was worried it might require pathfinding. Such as if the light source the beanstalk needs to grow towards is behind and obstacle. I have implemented the A* pathfinding algorithm in Unity2D before and was concerned about the kind of performance we might expect from a 3D one in an open environment. I was assured by my level designers that this wouldn’t be a problem since there should always be line-of-sight between the initial growth point and the destination light.
To achieve the desired functionality, the beanstalk could easily just grow in a straight line towards the destination. However this would have been unacceptable aesthetically. Beanstalks don’t just grow in straight lines. They curve and bend at their own whim. The majority of the implementation details are to accommodate this aesthetic.
Under the hood, the beanstalk is nothing but a spline. Splines are very frequently used in the Unreal Editor and our tech artists are more than capable of scripting them through blueprints. But dynamically creating one at runtime is a different thing entirely and best done in C++.
When the beanstalk initially grows, it does so in an arc. This is to give it an initial upward direction and then a smooth turn towards the destination. This required a little bit of 3D math since I had to create parametric equation for a point along an ellipse on a plane in 3D space:
\[\begin{align} & P(t) = c + a \ v_1 \cos(t) + b \ v_2 \sin(t) \\ & \text{where:} \\ & v_1 \text{ and } v_2 \text{ are orthogonal and define a plane} \\ & c \text{ is the center of the ellipse} \\ & a \text{ is the half-width of the ellipse} \\ & b \text{ is the half-height of the ellipse} \\ & t \text{ parametric parameter, in this case time} \end{align}\]Once the arc is done, the beanstalk again could grow in a straight line towards the destination. This still wasn’t very aesthetically pleasing. So I introduced some random variation to give the beanstalk a bit of a mind of its own. The randomization parameters as well as the parameters for the arc phase are all completely customizable in-editor for the level designers.
Tools
For all of my analytics capturing plugins, I save data off to a .csv file. Unreal has its own built-in analytics tools, but they save to .json files. My level designers who would actually be using this data expressed that they would love to be able to easily open the data into Excel, and .json files wouldn’t be very amenable to that. Thusly, I rolled my own solution and manually captured, stored, and wrote all the data to .csv files myself.
While some level designers preferred raw .csv data so they could parse the analytics themselves and draw up some useful statistics, others are much more visual. Thats why I also developed a plethora of ways to visualize the data in meaningful ways, often in 3D space within the Unreal Editor itself.
Input Logging
As a couch co-op game, our players will primarily be using controllers. Our level designers believed it would be useful to know when they press what buttons. For example, if they’re pressing jump a lot to try and get up a ledge that’s supposed to be easy to climb.
For visualizing the recorded input data for a playsession, I wrote C++ code that parses the CSV and spawns BillboardComponents at each location a button was pressed.
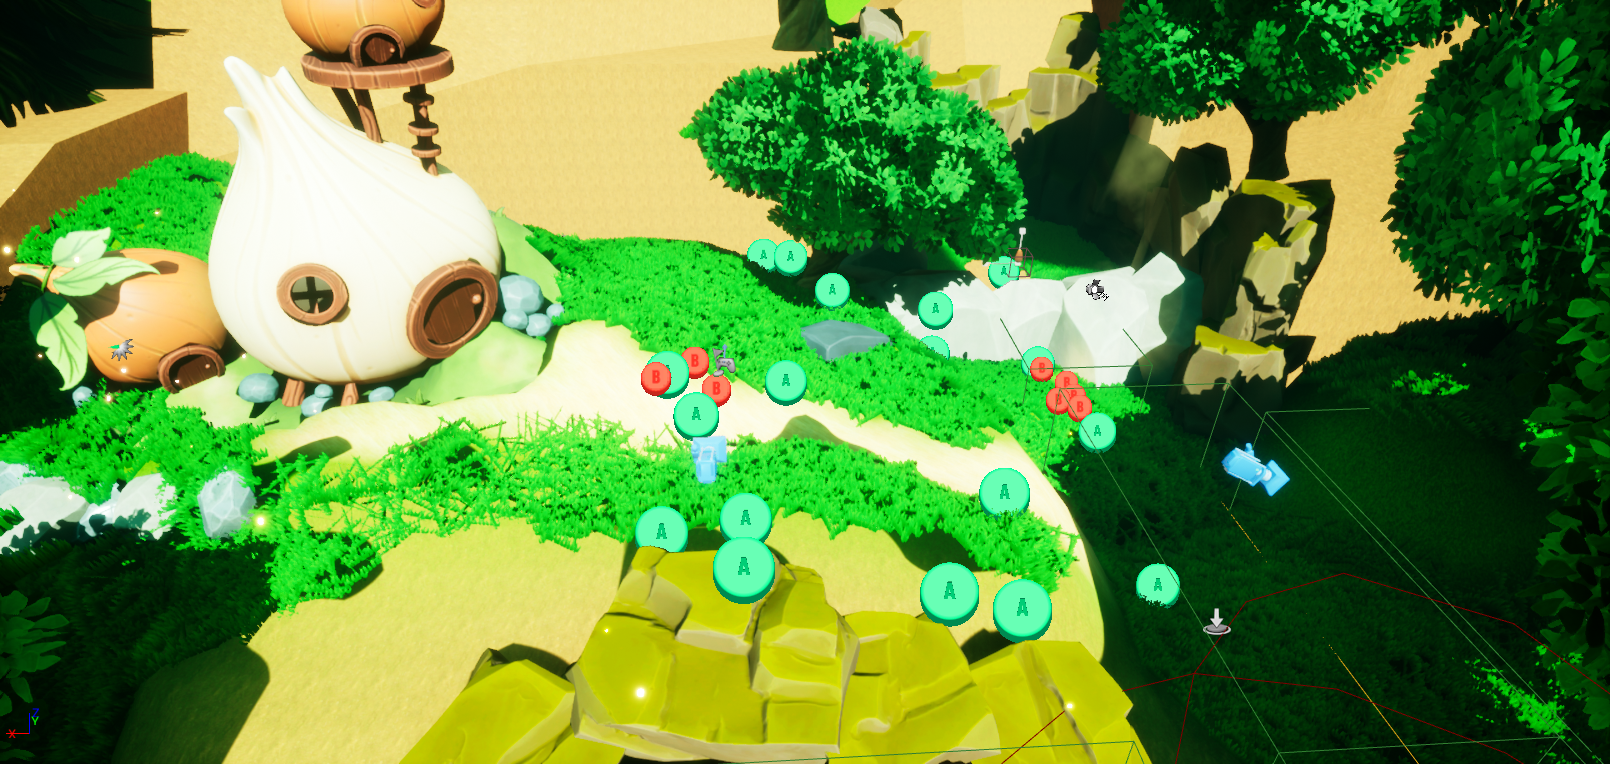
Users have complete control over what sprites are used for the various inputs. The inputs categories are retrieved directly from the action and axis bindings in the project settings.
Location Logging
The most important analytic tool I created was for logging player locations. When implementing this I had to be very memory-conscious as logging a position every frame could quickly lead to some unwanted bloat. Don’t believe me? Let’s do some math…
Unreal’s FVector is the size of three floats, so 12 bytes. If we record every frame at 60 frames per second over a 30 minute playsession, that comes to 12 bytes x 60 frames per second x 60 seconds in a minute x 30 minutes = 1296000 bytes = 1.296 megabytes. That might not sound like much, but I was looking ahead to scalability. If we implement an automated capture system that sends the analytics over the internet to a server, over thousands of playsessions this could quickly add up to gigabytes of data when much of it is just duplicates anyway. Plus locational data is only one of many different metrics we’re collected. If they’re all this bloated then the problem gets even worse.
We can scale this data down by a factor of 60 if we only capture a location once every second. Our game isn’t a fast-paced action title; we don’t expect the player to do much over the course of a second. So I set up my logger to use a timer with a user-configurable period of how often a location is logged. Assuming the level designer only wants to capture once every second, we’re now looking at 12 bytes x 60 seconds in a minute x 30 minutes = 21.6 kilobytes. That’s tiny! With numbers like that we’ll never have to worry about analytics impacting framerate or network performance.
To visualize the input log, one of the first tools you might use is my spline path generator. You load up a CSV into the editor and my C++ code automatically generates a spline in the scene of where the player went. You can load up as many CSVs as you like so you can compare the paths different players took or the different paths the same player took in separate sessions. There’s also a slider you can adjust to show exactly where the player was at a certain percentage of the way through the recording.
If you want to be able to visualize even more data, my 3D heatmap might be the tool for you. Similarly, you can load up as many CSVs as you like and turn each one on/off to alter the data being rendered. The 3D heatmap can be thought of as a volume which renders a window into the area it occupies. You can also toggle each z-layer so you can focus just on a single plane you might be interested in. You can manipulate the visibility by turning the alpha up or down.
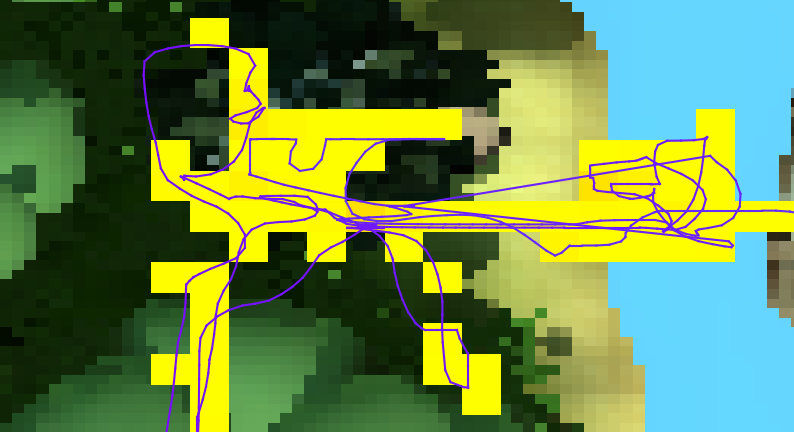
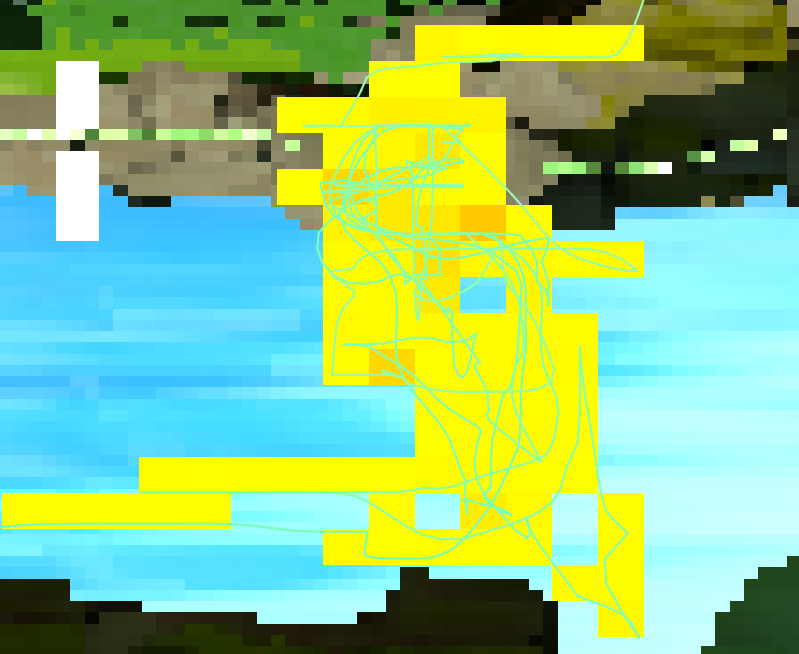
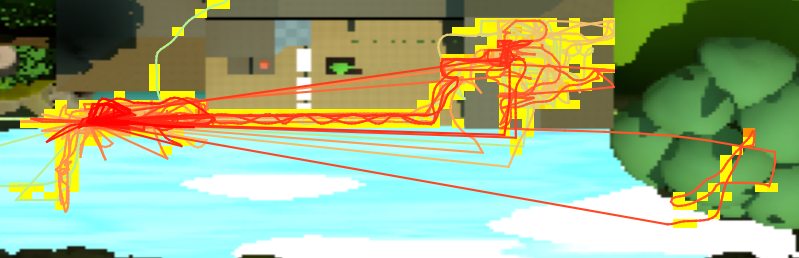
Sometimes opening the editor is just too much of a chore though. Especially if artists and level designers have gotten some work done over the weekend and Unreal needs to spend an hour compiling shaders or rebuilding lighting. That’s why I also wrote a Python script which accomplishes (most) of the functionality of the above visualizers. You feed the script a CSV and it spits back out a PNG of a top-down view of the level with a heatmap and the player’s path overlaid. My Unreal plugin includes an actor that can automatically take a top-down picture of the level and run the script for you.
Here you can see all of an anonymous user’s playtest data for the earliest version of our first level:
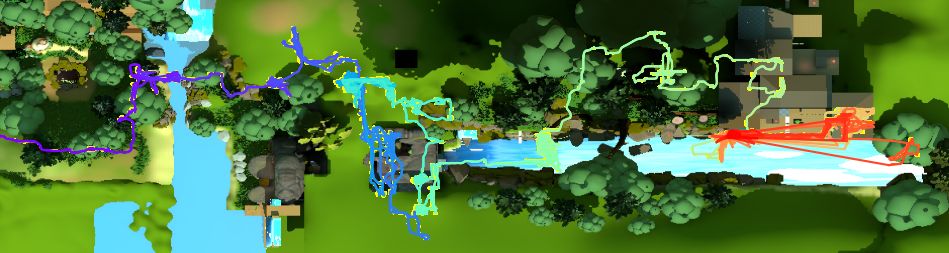
There’s a lot of useful playtest data here that we can gleam from a glance. All of the information I’m about to point out is just as obvious from watching the 45 minute video we also recorded of the playtest, but without having to spend 45 minutes watching a video.
CSV Logging
The level designers really wanted a way to track when the player was dying. I thought that a logger that only tracks deaths would be a bit too bland, so I came up with something better: a general-purpose CSV logger that can record any data. Through blueprint, you define your CSV header and at a time of your choosing feed the object the CSV data one row at a time. Here’s an example blueprint being used to recreate my InputLogger with the CSVLogger:
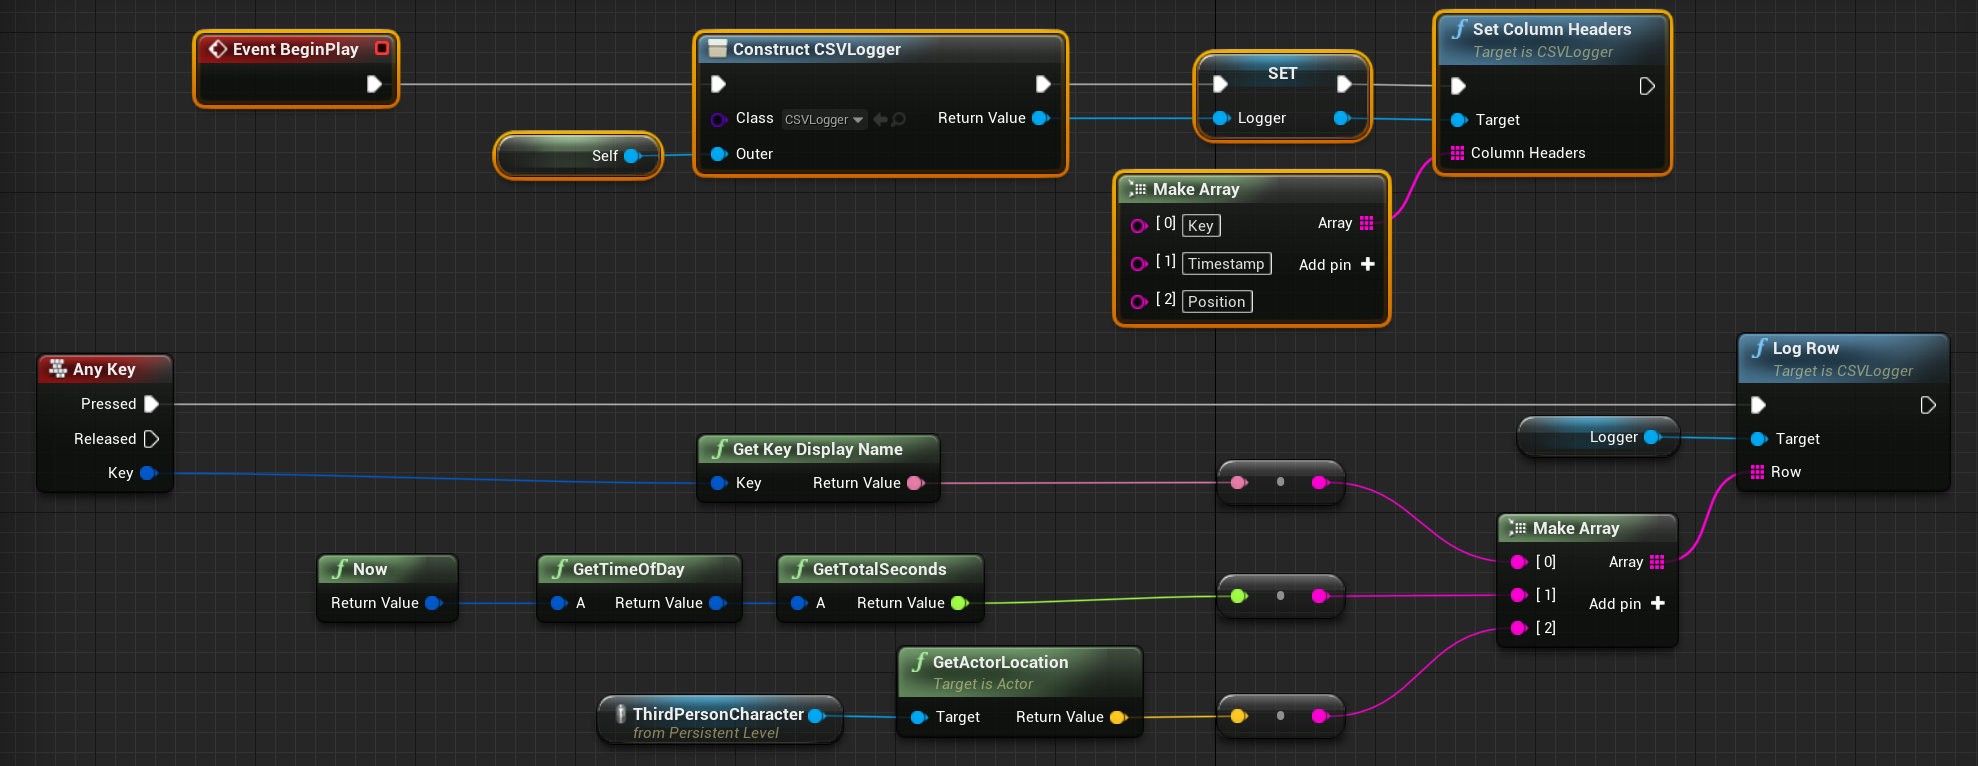
I also created a visualizer that works exactly the same as the InputLogger. I could reimplement all of my other loggers to use this general-purpose CSV logger but decided against it. The reason is that the CSV logger is a lot more memory hungry than the others. Since it has no idea about the data it’s storing, it can only store them as strings. For example, the LocationLogger only stores an FVector for every row, which is 12 bytes. As a string, its size is determined by how many characters the base 10 representation of the three component floats are. We’re already going to take up at least 12 bytes per row just because FVector::ToString outputs a string in the format X=%f Y=%f Z=%f.